
The New York real estate market continues to be a dominant force for investors, homeowners and homebuyers in 2016. As the most populous city in the United States, the first quarter saw the median home price for The Big Apple hit $467,900; making it home to the priciest real estate in the country. Conversely, appreciation rates for New York real estate were lukewarm compared to other markets such as Denver and Los Angeles, but should improve in coming years. That said, the New York real estate market should remain at the forefront of the most expensive real estate market in the nation.
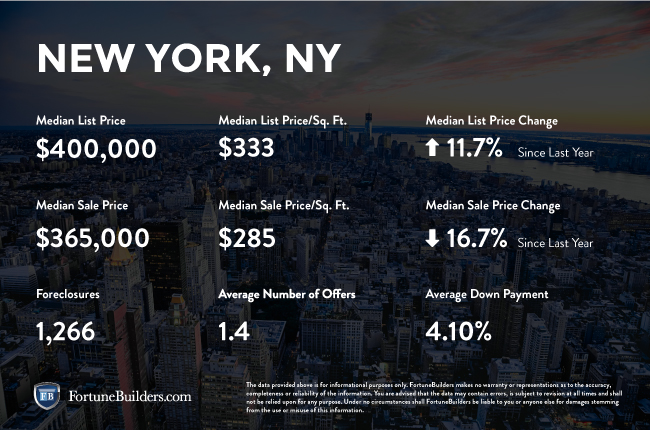
New York, NY Real Estate Market Statistics:
Although prices for the New York real estate market continue to skyrocket with each new week, home equity gains haven’t followed suit. The first quarter saw New York real estate appreciate at a rate of 0.3 percent compared to the national average of 6.1 percent. Growth has slowed compared to recent years, but the New York real estate market continues to be a haven for investors and homebuyers alike. For those considering New York real estate investments, the following provides a breakdown of appreciation rates in previous years:
- Homes purchased in the New York, NY housing market one year ago have appreciated, on average, by $9,033. The national average was $15,781 over the same period.
- Homes purchased in the New York, NY housing market three years ago have appreciated, on average, by $58,526. The national average was $49,356 over the same period.
- Homes purchased in the New York, NY housing market five years ago have appreciated, on average, by $62,238. The national average was $68,727 over the same period.
- Homes purchased in the New York, NY housing market seven years ago have appreciated, on average, by $86,596. The national average was $59,758 over the same period.
- Homes purchased in the New York, NY housing market nine years ago have appreciated, on average, by $12,681. The national average was $16,435 over the same period.
Home equity gains for the New York real estate market in the past three years have extended the trend of positive price growth after the recession. That said, New York real estate investors and homeowners saw the biggest gain in year seven when home prices appreciated, on average, by a whopping $86,596.
As of July 2016, there are currently 1,522 properties in the New York area in some stage of foreclosure. According to RealtyTrac, the number of New York foreclosures in the month of July was 76 percent higher than the previous month and five percent lower than the same time in 2015. Additionally, the number of REO properties in New York leaped 181.8 percent from the previous month and 106.7 percent from the same time last year. This bodes well for those considering New York real estate investing.
New York, NY: Real Estate Market Summary:

- Current Median Home Price: $467,900
- 1-Year Appreciation Rate: 0.3%
- 3-Year Appreciation Rate: 8.1%
- Unemployment Rate: 4.5%
- 1-Year Job Growth Rate: 5.3%
- Population: 19,800,075
- Median Household Income: $50,711
New York, NY: Real Estate Market (2016) — Q1 Updates:

So far in 2016, the New York real estate market has endured a combination of highs and lows. Along with surging home prices and subtle appreciation rates, New York is enjoying an improved economy that has grown to become one of the strongest in the nation. The first quarter saw New York’s unemployment rates hover around the national average, as the current unemployment rate in New York is 5.3 percent compared to the rest of the country at 5.0 percent, but there is still good news: unemployment rates in New York have declined 0.6 percent percent from a year ago. Job growth in the first quarter for the City that Never Sleeps was 2.4 percent — or 0.4 percent better than the national average of 2.0 percent.
The one lagging component for the New York real estate market is new housing construction, which appears to have drastically slowed in recent times. The current level of construction for New York real estate is 28.1 percent above the long-term average, while single-family housing permits were -1.7 percent for the first quarter of 2016 compared to the national average of 11.3 percent. While this is may be great news for a New York real estate investing, at the same time, it does affect home affordability.
As one of the least affordable markets in the nation, homeowners in New York paid roughly 16.0 percent of their income on monthly mortgage payments during the first quarter of 2016, while the rest of the nation paid 14.5 percent for housing. Surprisingly, that’s lower than New York’s historical average which is an eye-popping 22.2 percent. That said, home affordability for the New York housing market continues to improve; Compared to the same period in 2015, homeowners paid 0.5 percent less in Q1 2016.
Moving forward, the National Association of Realtors (NAR) forecasts the New York real estate market to experience weaker prices in the next 12 months. Price expectation for New York real estate remain unchanged from the previous 12 months, as the first quarter of 2016 was 3.1 percent compared to the national average of 3.8 percent. That said, New York real estate investments continue to be as prosperous as ever, and the trend should continue in 2016 and beyond.