
San Jose, the home of eBay, Cisco and Adobe, has asserted its dominance throughout the real estate industry for the better part of a decade. It remains one of the hottest markets in the most expensive state. For the moment, there is little to suggest that the San Jose real estate market will change directions.
Few markets across the country are as hot as the San Jose real estate market is at the moment. Prices in the area continue to rise at an unprecedented pace, making San Jose one of the most expensive areas in California – as well as the country. With an appreciation rate of nearly 10.3% over the course of last year, and upwards of 44.7% in the last three years, it is not surprising that the median home price in San Jose is about four times that of the national average. At $855,000; the average home price in San Jose trumps just about every other market. While even the highly touted Houston and Dallas markets have higher appreciation rates, median home prices are not even one-fourth of that of the San Jose real estate market.
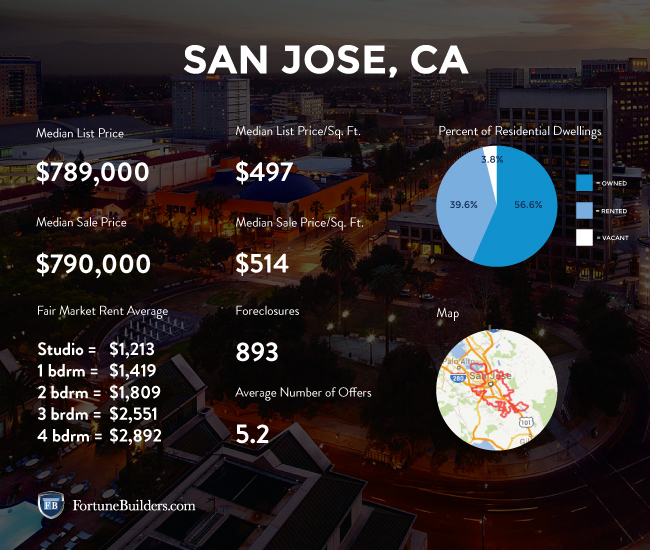
San Jose Real Estate Market Statistics
No other market in the country has seen gains in equity that can parallel those seen in San Jose. In fact, homes that were purchased just five years ago have already appreciated by an average of $314,322. The gain in equity alone rivals some of the country’s most popular metro home prices. Gains have been impressive to say the least. For a more comprehensive breakdown, the following list shows just how much equity has been gained relative to the year of purchase:
- Homes purchased in the San Jose housing market one year ago have appreciated, on average, by $91,819. The national average was $14,170 over the same period.
- Homes purchased in the San Jose housing market three years ago have appreciated, on average, by $333,472. The national average was $53,857 over the same period.
- Homes purchased in the San Jose housing market five years ago have appreciated, on average, by $314,322. The national average was $48,036 over the same period.
- Homes purchased in the San Jose housing market seven years ago have appreciated, on average, by $89,803. The national average was $13,870 over the same period.
- Homes purchased in the San Jose housing market nine years ago have appreciated, on average, by $208,928. The national average has actually decreased $2,822 over the same period.
San Jose remains one of the largest tech industry hubs and continues to draw the attention of the country’s most prominent industries. That said, employment in the area is doing more than surviving: it is thriving. With an unemployment rate of 4.6%, San Jose is under the national average of 5.6 percent. Over the last year, that rate has improved an impressive 1.2 percent. Of particular interest, however, is the expected job growth rate. At 1.9%, the national average is healthy, but San Jose’s growth rate is more than double that. With a growth rate expected to reach 4% in the coming year, San Jose’s job sector should continue to support both supply and demand within the housing sector.
For everything that San Jose has going for it, the housing market remains one of the most unaffordable to live and/or rent in. In fact, San Jose residents dedicate nearly twice as much of their monthly income to mortgage payments than the average household in the rest of the country. As recently as the end of last year, San Jose homeowners spent about 26.1% of their income on monthly premiums, whereas the rest of the country spent about 15.1 percent. Affordability in the San Jose housing market continues to be a problem, as a unique inability to build more housing undercuts price easement. By the end of 2014, prices in San Jose were up 10.3%, pushing them almost 9% above their pre-recession highs.
Trulia recognizes the following neighborhoods as the most popular in the San Jose:
- Edenvale
- Central San Jose
- Willow Glen
- Evergreen
- South San Jose
Of those that made the list, Edenvale and Central San Jose are the most popular, with average listing prices of $500,688 and $630,517.
Zillow goes as far as saying that the San Jose real estate market is “very healthy.” The one-year forecast provided by experts only supports the notion of a healthy real estate sector. In fact, prices are expected to rise approximately 3.8 % in the next 12 months.
The San Jose real estate market currently has about 169 homes available for sale. Of those homes made available on the market, the median list price is $666,500; according to RealtyTrac. The actual median sales price, however, is more than $26,000 less than asking. That number is up about $3,000 from the previous year.
The San Jose real estate market has about 1,058 homes that have entered into the foreclosures process. According to RealtyTrac, “in January, the number of properties that received a foreclosure filing in San Jose, CA was 48% higher than the previous month and 8% higher than the same time last year.” The median price for a home that is in foreclosure (default, auction or bank owned) has increased 2% over the last 12 months to $577,250. That is a 9.8% discount compared to the median sales price for the area. Of the houses under threat of foreclosure, 32.2% are considered to be “pre-foreclosure.” That number is down 7.4% in the last month and 37% from the previous year. The decline in pre-foreclosure properties is attributed to recent appreciation rates. However, the number of foreclosures placed up for auction increased 101.6% in the last month. Auctions now make up 46.3% of all foreclosures in the San Jose real estate market. Coming in last place, bank-owned properties constitute just 21.5% of all foreclosures in the San Jose housing market.
San Jose Real Estate Market Summary:
- Current Median Home Price: $855,000
- 1-Year Appreciation Rate: 10.3%
- Unemployment Rate: 4.6%
- 1-Year Job Growth Rate: 4%
- Population: 925,300
- Median Household Income: $91,533
San Jose Real Estate Market Q2 Update:
The last time we checked in on the San Jose real estate market, it was one of the hottest markets in the country. It’s close proximity to San Francisco has continued to serve the area well. Both median home prices and appreciation rates have increased in one quarter’s time. With a current one-year appreciation rate of 11.4 percent, San Jose real estate is increasing in value almost twice as fast as the national average, which currently sits at 6.7 percent. Recent gains have now brought the area’s median home price up to $900,000; and prices are continuing to grow relative to last year. In fact, the San Jose real estate market’s median home price is more than four times that of the national average.
Every strong housing market receives a significant amount of support from the local economy, and San Jose is no exception. The area’s unemployment rate has dropped, yet again, to an impressive 4.2 percent. That is 1.3 percent less than the national average, and almost two percent better than it was last year. Perhaps even more importantly, San Jose’s job growth rate has increase1.5 percent since the last time we looked at it, about five months ago. There is no denying the strength of the local economy, as it houses some of the world’s most impressive startups. This bodes very well for San Jose real estate investing, and the housing market in general.
San Jose County Map:
